Section 3 Inspecting Accessible Diagrams
The resulting SVG will be fully accessible and can be inspected in a browser either visually or via keyboard interaction, speech output and sonification. In addition, it is easy to generate alternate formats: Tactile graphics are generated by exploiting MathJax's ability to generate Braille for tactile formula labels. Similarly audio-tactile graphics can be produced that can work with the ViewPlus' Iveo technology by embedding the speech annotations as title and description elements into the SVG. This type of SVG can also be used in environments and ebook readers where no JavaScript is available, simulating navigation by a simple tabindex structure. However, in the remainder of the section we will explain accessibility for the browser provision.
We employ AJAX functionality to import both SVG and the XML annotations into a web page and inject the diagcess library to provide the bridge between annotations and graphical elements. The main feature of our accessible diagrams is the ability for a reader to interact with it via step-wise navigation. The basic browsing functionality is implemented by an explorer attached to the SVG element as event listener. A screenreader user is alerted to its existence via a dedicated ARIA label. The explorer can be entered via keystroke
Enter or mouse click and left with Escape. Once the explorer is active, the user can navigate using the arrow keys and switch features, such as magnification, color changes, and sonification via additional keys. Technically these functionalities are realised as follows:- Aural Rendering is achieved by multiple means. Either directly by speaking using the browser's speech synthesis API or if a screen reader is used by updating a speech string in a DOM element designated as ARIA live region. In addition, speech can be presented as subtitles during navigation.
- Highlighting is automatic and synchronised with the aural rendering so that elements are highlighted as they are being described. Highlighting is achieved by dynamically changing the CSS parameters of the SVG nodes concerned.
- Color Adaptation is used to provide support for readers that benefit from high contrast as well as for easier integration into dark modes of browsers. While the application offers a number of default contrast models, these are customisable and adaptable to the surrounding text.
- Magnification is an option of the explorer module and technically achieved via SVG animation, realising the zoom by gradually constraining the View Box of the SVG element to the components that are currently being described.
- Sonification is optionally available for designated SVG polyline and paths elements using an oscillator model via the Web Audio API.
For browsing the diagram, we have chosen a relatively simple exploration model that was originally designed for working with chemical diagrams [11] and honed in further user testing [4]. Granularity and range of movement is determined by the annotation structure as described in the previous section.
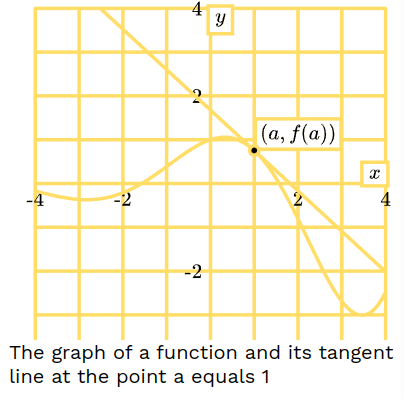


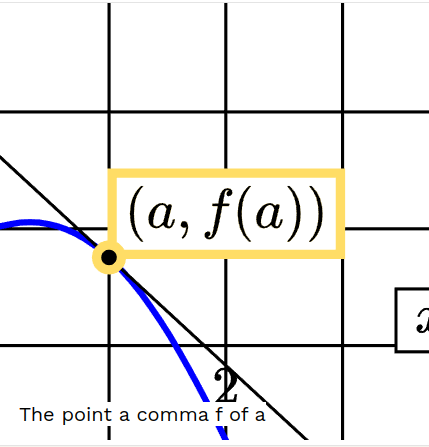
To illustrate, we observe the traversal of our example diagram in figure 3.1. Note how the subtitles correspond to the annotations presented in the previous section. Here the yellow highlights represent the components of the diagram under consideration. Initially the entire diagram is highlighted. When going
Down, the axes are first announced with additional information, requested using the X key, giving the range of both the x and y axis. Moving Right on that level, we examine the graph and tangent line together. Going Down again we can inspect the function's graph while moving Right highlights the point and finally the tangent line. Both graphs can be sonified by pressing O. We then reach a boundary, indicated by an earcon, with a final Right.Labels are treated distinctly to structural components of the diagram should they contain mathematical formulas. While they can be manually described by the author by providing a dedicated annotation element, we also exploit the fact that they are rendered with MathJax, which can provide accessibility support via the Speech Rule Engine [10]. This means that formulas are rendered as SVG with an attached aria-label containing a corresponding speech string — which can be localised or given in Braille. At the moment we only expose the top-most aria-label as an alternative to the manual description if one is given. However, SRE can also embed speech deeply into the rendered formula, with one speech string per subexpression, together with a navigation structure based on a semantic interpretation of the formula. This feature can be useful for more complex formulas as the differential equation in Figure 1.1. We aim to integrate this as a future feature.
